
USB-CAN FD Real-Time Latency Benchmark Report: Methodology, Multi-Device Statistical Analysis, and Raw Datasets
Documents the controlled Linux PREEMPT_RT test bench, per-frame bit-stuffing deduction model, full quantile tables, and multi-dimensional statistical analysis across 8 hardware/firmware/driver setups, 1 cross-port repeat run, and 11 operating-point sweeps (3.8M frames, zero drops).
Executive Summary
This report documents controlled transmit/receive path latency measurements conducted on a single Linux PREEMPT_RT workstation across 8 USB-CAN FD hardware, firmware, and SocketCAN driver configurations, plus 1 independent cross-port repeatability run and 11 bit-rate/period sweep conditions.
Using a single-host dual-channel external loopback bench, four synchronized software timestamps (CLOCK_MONOTONIC_RAW and SO_TIMESTAMPING) are captured per frame, and exact ISO 11898-1:2015 wire duration TCAN is deducted frame by frame to isolate one-way interface path latency out to the 99.99th percentile:
- Order-of-magnitude latency separation across architectures: Under the
1 / 8 Mbit/s · DLC 0 · 100 µsbaseline,KH-UCANFD-B2B-X4(KHCM104+ native KCAN firmware +kcandriver, D04) records a kernel one-way mean of 42.174 µs, P99 of 65.014 µs, and P99.9 of 78.054 µs, whereas tested conventional bus analyzers average 145.241–369.419 µs with P99 bounds of 216.590–640.123 µs. - Controlled isolation confirms device-side forwarding dominates: Holding Ubuntu's stock
peak_usbdriver constant while replacing PEAK-System PCAN-USB Pro FD (D06,369.419 µs) withKH-UCANFD-X2I(D08) lowers kernel mean to 48.307 µs (eliminating 321.112 µs of device-side forwarding delay). Switching the sameKH-UCANFD-X2Ito the nativekcandriver (D05) lowers mean by another 6.238 µs to 42.069 µs and tightens P99 by 12.441 µs. - High reproducibility and thermal stability: Over 30 consecutive rounds per setup, no cumulative drift occurs; an independent 300,000-frame run on a separate chipset USB root port (D08 vs. R01) agrees within 0.082 µs.
NOTE
For a concise selection overview and 1–2 kHz multi-joint robotic closed-loop cycle budgets based on this dataset, see the companion guide: How High Is USB-to-CAN Latency? Multi-Device Linux RT Benchmark and 1–2 kHz Real-Time Control Verification.
1. Controlled Test Bench and Configuration Matrix
1.1 Host Workstation and Real-Time Isolation Specifications
| Control Dimension | Bench Specification | Error-Control Purpose |
|---|---|---|
| Host Workstation | Dell OptiPlex 7050 (Intel Core i3-7100 @ 3.90 GHz, x86_64) | Fixed xHCI host controller and constant single-core clock baseline |
| OS & Kernel | Ubuntu 22.04.5 LTS · Linux 5.15.0-1100-realtime | PREEMPT_RT full preemption eliminates non-preemptible kernel latency spikes |
| Scheduling Policy | POSIX SCHED_FIFO, static priority 90 | Prevents background tasks from preempting TX/RX measurement threads |
| CPU Core Affinity | TX thread pinned to CPU 1, RX thread pinned to CPU 0 | Isolates TX/RX context switching and prevents cross-core cache migration |
| External Loopback | can0 → can1 via 0.3 m shielded twisted pair, dual 120 Ω termination | Negligible wire propagation (< 2 ns) and clean signal edges at 8 Mbit/s |
| Sample Scale | 30 rounds × 10,000 frames = 300,000 frames/setup; nearest-rank quantiles | High statistical confidence out to P99.99 |
1.2 Hardware, Firmware, and Driver Matrix (D01–D08, R01)
Tested physical hardware units and official product pages (click thumbnails to enlarge, or click model names for specifications):
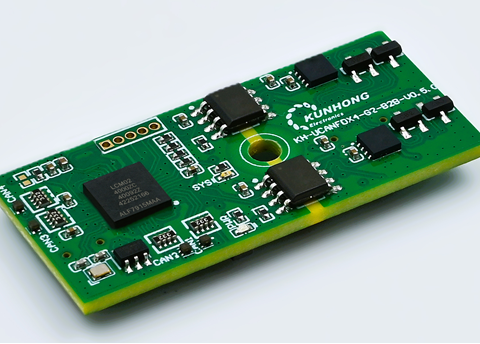
4-ch board-to-board module running native KCAN X4 firmware & SDK kcan driver.
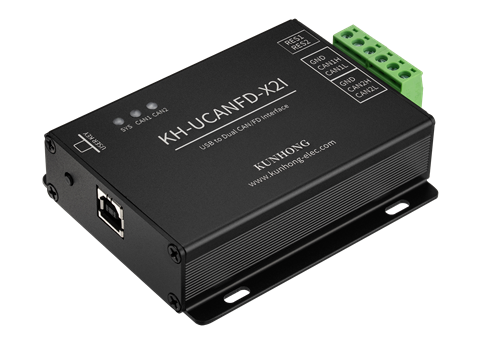
Dual-channel isolated adapter evaluated under both SDK kcan & in-tree peak_usb.
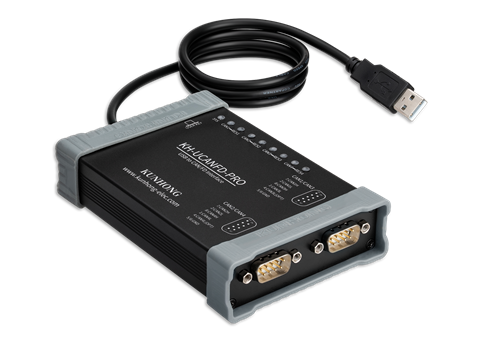
4-channel CANmeleon unit tested under Kvaser FD and GS USB firmware paths.
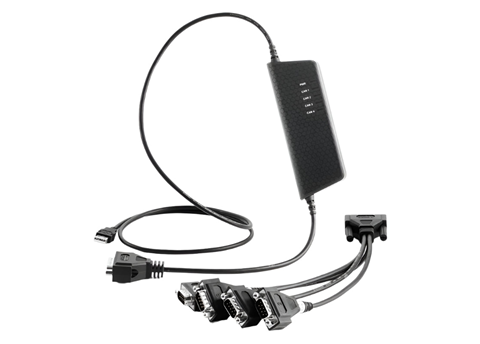
Kvaser AB 4-channel interface (FW 3.25.855, in-tree kvaser_usb driver).
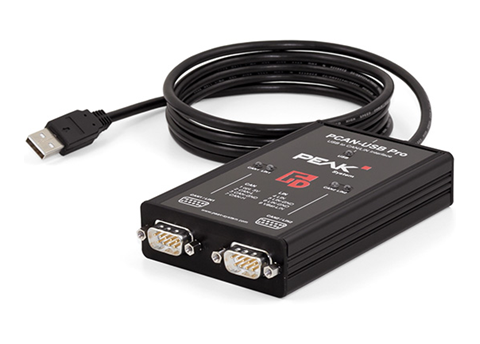
PEAK-System dual-channel analyzer (IPEH-004061, FW 3.5.4, in-tree peak_usb).
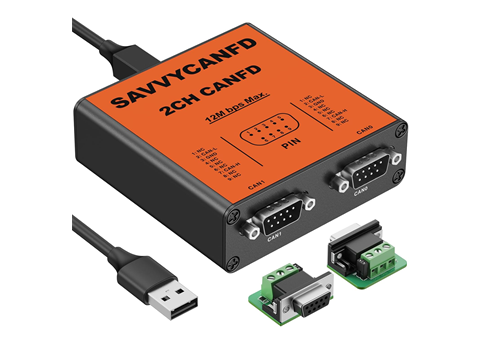
Pibiger dual-channel adapter (FW 3.2.0, compatible with in-tree peak_usb).
| ID | Physical Hardware Model | Device Firmware & Version | Host SocketCAN Driver | Experimental Role |
|---|---|---|---|---|
| D01 | Kvaser USBcan Pro 4xHS | Vendor firmware 3.25.855 | In-tree kvaser_usb | Conventional analyzer baseline (kvaser_usb) |
| D02 | KH-UCANFD-PRO-X4U (4-Ch CANmeleon) | CANmeleon Kvaser FD firmware · 8.15.2 | In-tree kvaser_usb | Same kvaser_usb driver hardware comparison |
| D03 | KH-UCANFD-PRO-X4U (4-Ch CANmeleon) | CANmeleon GS USB firmware · 8.15.2 | Adapted gs_usb | Open-source gs_usb stack comparison |
| D04 | KH-UCANFD-B2B-X4 (KHCM104) | KCAN X4 native firmware · 8.15.2 | SDK kcan (1.5.0) | Native KCAN firmware + native driver baseline |
| D05 | KH-UCANFD-X2I dual-channel adapter | CANmeleon PCAN Pro FD firmware · 8.15.2 | SDK kcan (1.5.0) | Same-hardware driver comparison with D08 |
| D06 | PEAK-System PCAN-USB Pro FD | Vendor firmware 3.5.4 | In-tree peak_usb | Conventional analyzer baseline (peak_usb) |
| D07 | Pibiger SavvyCAN-FD-X2 | Firmware 3.2.0 (peak_usb USB ID compatible) | In-tree peak_usb | Third-party dual-channel (peak_usb) comparison |
| D08 | KH-UCANFD-X2I dual-channel adapter | CANmeleon PCAN Pro FD firmware · 8.15.2 | In-tree peak_usb | Same peak_usb driver hardware comparison |
| R01 | KH-UCANFD-X2I dual-channel adapter | CANmeleon PCAN Pro FD firmware · 8.15.2 | In-tree peak_usb | Independent repeat run on a separate USB root port |
2. Measurement Methodology, Timestamp Boundaries, and Wire Deduction
2.1 Single-Host Loopback Topology and Four-Point Timestamps
On the single-host loopback bench (Figure 1), every frame is timestamped at four boundaries against the same x86 Invariant TSC clock source:
Use Play data path below to inspect all nine stages of an example single-frame acquisition (#2899):
Subtract CAN frame transmission time from the kernel TX-to-RX interval to obtain total path time Trt. Assuming symmetric TX and RX paths, TX or RX path latency is approximately Trt / 2 — approximately 40 µs in this example. This is the primary TX/RX latency metric for the relevant KCAN products and the charts below; the application one-way estimate is a secondary comparison.
T1: before write(); T2 / T3: kernel TX / RX software timestamps; T4: after recvmsg(). Ttx is kernel TX path time and Trx is kernel RX path time, calculated symmetrically; Tsof, Teof and intermediate positions are illustrative. CAN duration is calculated for the actual DLC 0 frame (SOF to EOF, excluding intermission); the waveform illustrates DLC 8 structure.
Record T1 before write(can0), the start of the application TX-to-RX interval.
The four Linux timestamp hooks (see kernel Timestamping documentation) are defined as follows:
| Point | Capture Location | Linux API & Clock Source | Boundary Meaning |
|---|---|---|---|
| T1 | Immediately before write(can0) | clock_gettime(CLOCK_MONOTONIC_RAW) | Application TX start |
| T2 | Netstack handoff to driver TX | SO_TIMESTAMPING (SOF_TIMESTAMPING_TX_SOFTWARE) | Kernel TX path start |
| T3 | Peer driver RX skb handoff to netstack | SO_TIMESTAMPING (SOF_TIMESTAMPING_RX_SOFTWARE) | Kernel RX path end |
| T4 | Immediately after recvmsg(can1) returns | clock_gettime(CLOCK_MONOTONIC_RAW) | Application RX end |
2.2 Symmetric One-Way Path Model
Subtracting exact per-frame physical bus wire duration TCAN yields bilateral path transit time Trt, which is halved under a symmetric TX/RX model:
- Primary metric (kernel boundary, Eq. 1): Isolates unilateral transit time across SocketCAN driver, USB link, and adapter hardware/firmware from user-space wakeup jitter.
- System-level secondary metric (application boundary, Eq. 2): Includes bilateral
write()/recvmsg()syscalls, socket buffer copies, andSCHED_FIFOthread wakeup. In closed-loop transactions where TX and RX occur in pairs (Ttx + Trx = Trt), any directional asymmetry cancels identically.
2.3 DLC 0 Rationale and ISO 11898-1:2015 Per-Frame Wire Equation
All cross-device sets use standard 11-bit ISO CAN FD frames with BRS (Rnom = 1 Mbit/s, Rdata = 8 Mbit/s), L = 0 B (DLC 0), and a 100 µs period:
- Signal-to-noise ratio: Compresses physical bus time to ~
30.5 µsso adapter and driver path latency remains the dominant measured quantity. - Eliminating dynamic bit-stuffing pseudo-jitter: Under ISO 11898-1:2015, exact physical duration from
SOFtoEOF(excluding 3-bitIFS) for an L-byte standard frame withBRS = 1is:
where Nctrl+crc = 33 bits for L ≤ 16 B (DLC, 4-bit Gray SBC, 17-bit CRC, delimiters, ACK, 7-bit EOF, and 6 fixed stuff bits) and 38 bits for L > 16 B (21-bit CRC and 7 fixed stuff bits), while snom and sdata are exact dynamic stuff-bit counts before and after BRS.
Across 300,000 incrementing IDs (seq & 0x7FF), DLC 0 wire time spans 30.125–33.125 µs (mean 30.513 µs, std 0.564 µs). Computing and subtracting exact per-frame TCAN (verifiable via the Online CAN/FD Frame Length & Waveform Calculator) prevents the 3.0 µs protocol frame-length variation from contaminating jitter metrics.
3. Cross-Device Latency Distributions and Tail Determinism
3.1 Full Quantile Summary Tables Across All Nine Setups
All values below are reported in microseconds (µs) across 300,000 frames per setup.
Table 3-1: Kernel One-Way Path Latency Quantiles (((T3 − T2) − T_CAN) / 2)
| ID | Setup Summary (FW / Driver) | Min | Mean | P50 | P95 | P99 | P99.9 | P99.99 | Max | Std |
|---|---|---|---|---|---|---|---|---|---|---|
| D05 | KH-UCANFD-X2I (PCAN FD / kcan) | 22.474 | 42.069 | 41.989 | 53.293 | 64.795 | 77.710 | 79.609 | 85.756 | 7.330 |
| D04 | KH-UCANFD-B2B-X4 (KCAN / kcan) | 21.902 | 42.174 | 42.149 | 53.282 | 65.014 | 78.054 | 79.917 | 93.903 | 7.319 |
| D08 | KH-UCANFD-X2I (PCAN FD / peak_usb) | 24.440 | 48.307 | 46.107 | 61.345 | 77.236 | 81.128 | 83.710 | 95.398 | 7.467 |
| R01 | KH-UCANFD-X2I Repeat (peak_usb) | 25.067 | 48.389 | 46.268 | 61.811 | 76.997 | 81.850 | 83.157 | 85.810 | 7.413 |
| D02 | KH-UCANFD-PRO-X4U (kvaser_usb) | 32.866 | 53.741 | 52.012 | 68.205 | 78.301 | 82.226 | 88.016 | 96.900 | 8.257 |
| D03 | KH-UCANFD-PRO-X4U (gs_usb) | 24.577 | 55.545 | 48.392 | 78.320 | 84.853 | 89.105 | 91.656 | 104.076 | 14.239 |
| D07 | Pibiger SavvyCAN-FD-X2 (peak_usb) | 37.127 | 60.696 | 57.942 | 80.490 | 83.973 | 89.308 | 92.319 | 98.662 | 11.403 |
| D01 | Kvaser USBcan Pro 4xHS (kvaser_usb) | 56.367 | 145.241 | 146.916 | 203.130 | 216.590 | 228.318 | 238.645 | 251.166 | 37.108 |
| D06 | PEAK-System PCAN-USB Pro FD (peak_usb) | 63.976 | 369.419 | 370.874 | 617.574 | 640.123 | 649.546 | 670.789 | 689.627 | 158.231 |
Table 3-2: Application One-Way Path Latency Quantiles (((T4 − T1) − T_CAN) / 2)
| ID | Setup Summary (FW / Driver) | Min | Mean | P50 | P95 | P99 | P99.9 | P99.99 | Max | Std |
|---|---|---|---|---|---|---|---|---|---|---|
| D05 | KH-UCANFD-X2I (PCAN FD / kcan) | 26.230 | 48.107 | 48.422 | 60.364 | 72.188 | 84.588 | 87.288 | 103.109 | 7.672 |
| D04 | KH-UCANFD-B2B-X4 (KCAN / kcan) | 25.462 | 48.465 | 48.890 | 60.848 | 72.632 | 85.351 | 87.672 | 103.504 | 7.649 |
| D08 | KH-UCANFD-X2I (PCAN FD / peak_usb) | 29.564 | 54.971 | 53.202 | 68.170 | 83.496 | 88.436 | 93.082 | 115.922 | 7.617 |
| R01 | KH-UCANFD-X2I Repeat (peak_usb) | 30.774 | 55.542 | 54.105 | 69.332 | 83.610 | 89.997 | 94.517 | 114.054 | 7.629 |
| D03 | KH-UCANFD-PRO-X4U (gs_usb) | 29.489 | 61.564 | 54.790 | 84.223 | 92.585 | 96.653 | 100.063 | 112.608 | 14.275 |
| D02 | KH-UCANFD-PRO-X4U (kvaser_usb) | 39.402 | 63.752 | 62.135 | 79.752 | 90.152 | 93.712 | 104.138 | 121.777 | 9.030 |
| D07 | Pibiger SavvyCAN-FD-X2 (peak_usb) | 41.744 | 67.388 | 64.627 | 87.396 | 91.738 | 97.434 | 105.744 | 116.561 | 11.532 |
| D01 | Kvaser USBcan Pro 4xHS (kvaser_usb) | 63.109 | 158.353 | 158.445 | 219.732 | 234.880 | 247.190 | 262.426 | 306.969 | 37.696 |
| D06 | PEAK-System PCAN-USB Pro FD (peak_usb) | 77.067 | 404.416 | 405.189 | 641.145 | 661.979 | 677.494 | 697.783 | 714.928 | 151.725 |
Kernel one-way estimate · µs · Symmetric TX/RX estimate; lower values indicate shorter path times.
Hover or focus a device row for values; full statistics are available below.
Full statistics (µs)
| Configuration | Mean | P50 | P95 | P99 | Observed max | Std. dev. |
|---|---|---|---|---|---|---|
| D01 · Kvaser USBcan Pro 4xHSkvaser_usb · 300,000 frames | 145.241 | 146.916 | 203.130 | 216.590 | 251.166 | 37.108 |
| D02 · CANmeleon / Kvaser FDkvaser_usb · 300,000 frames | 53.741 | 52.012 | 68.205 | 78.301 | 96.900 | 8.257 |
| D03 · CANmeleon / GS USBgs_usb · 300,000 frames | 55.545 | 48.392 | 78.320 | 84.853 | 104.076 | 14.239 |
| D04 · KCAN X4kcan · 300,000 frames | 42.174 | 42.149 | 53.282 | 65.014 | 93.903 | 7.319 |
| D05 · CANmeleon / PCAN FDkcan · 300,000 frames | 42.069 | 41.989 | 53.293 | 64.795 | 85.756 | 7.330 |
| D06 · PEAK-System PCAN-USB Pro FDpeak_usb · 300,000 frames | 369.419 | 370.874 | 617.574 | 640.123 | 689.627 | 158.231 |
| D07 · Pibiger SavvyCAN-FD-X2peak_usb · 300,000 frames | 60.696 | 57.942 | 80.490 | 83.973 | 98.662 | 11.403 |
| D08 · CANmeleon / PCAN FDpeak_usb · 300,000 frames | 48.307 | 46.107 | 61.345 | 77.236 | 95.398 | 7.467 |
3.2 Empirical CDF and Tail Dispersion Analysis
Use the Comparison dropdown below to filter specific experimental subsets:
Kernel one-way estimate · µs · Symmetric TX/RX estimate; lower values indicate shorter path times.
A curve further left has lower latency at the same cumulative proportion. Curves connect quantile points; see the table for exact summary statistics.
Full statistics (µs)
| Configuration | Mean | P50 | P95 | P99 | Observed max | Std. dev. |
|---|---|---|---|---|---|---|
| D01 · Kvaser USBcan Pro 4xHSkvaser_usb · 300,000 frames | 145.241 | 146.916 | 203.130 | 216.590 | 251.166 | 37.108 |
| D02 · CANmeleon / Kvaser FDkvaser_usb · 300,000 frames | 53.741 | 52.012 | 68.205 | 78.301 | 96.900 | 8.257 |
| D03 · CANmeleon / GS USBgs_usb · 300,000 frames | 55.545 | 48.392 | 78.320 | 84.853 | 104.076 | 14.239 |
| D04 · KCAN X4kcan · 300,000 frames | 42.174 | 42.149 | 53.282 | 65.014 | 93.903 | 7.319 |
| D05 · CANmeleon / PCAN FDkcan · 300,000 frames | 42.069 | 41.989 | 53.293 | 64.795 | 85.756 | 7.330 |
| D06 · PEAK-System PCAN-USB Pro FDpeak_usb · 300,000 frames | 369.419 | 370.874 | 617.574 | 640.123 | 689.627 | 158.231 |
| D07 · Pibiger SavvyCAN-FD-X2peak_usb · 300,000 frames | 60.696 | 57.942 | 80.490 | 83.973 | 98.662 | 11.403 |
| D08 · CANmeleon / PCAN FDpeak_usb · 300,000 frames | 48.307 | 46.107 | 61.345 | 77.236 | 95.398 | 7.467 |
- Tight narrow-band convergence (D04, D05, D08, D02): Standard deviation on D04 and D05 is 7.32–7.33 µs, with median P50 (
42.149 µs) closely matching mean (42.174 µs). CDF curves rise steeply within35–55 µsand stay below 80 µs even at P99.99. - Broad right-hand dispersion (D01, D06): Standard deviation widens to 37.108 µs on D01 (
56–251 µs) and 158.231 µs on D06, whose linear ramp across100–620 µsreflects wide residence-time dispersion across internal software forwarding stages.
4. Layer-by-Layer Hardware and Software Isolation
Kernel one-way estimate · µs · Symmetric TX/RX estimate; lower values indicate shorter path times.
Hover or focus a device row for values; full statistics are available below.
Full statistics (µs)
| Configuration | Mean | P50 | P95 | P99 | Observed max | Std. dev. |
|---|---|---|---|---|---|---|
| D05 · CANmeleon / PCAN FDkcan · 300,000 frames | 42.069 | 41.989 | 53.293 | 64.795 | 85.756 | 7.330 |
| D08 · CANmeleon / PCAN FDpeak_usb · 300,000 frames | 48.307 | 46.107 | 61.345 | 77.236 | 95.398 | 7.467 |
4.1 Holding the Host Driver Constant to Isolate Device Hardware
peak_usbtrio (D06 vs. D07 vs. D08): Under identical stockpeak_usb, PEAK-System PCAN-USB Pro FD (D06) averages 369.419 µs (P99640.123 µs), Pibiger SavvyCAN-FD-X2 (D07) averages 60.696 µs, andKH-UCANFD-X2I(D08) drops to 48.307 µs (P9977.236 µs)—reducing mean latency by 321.112 µs and P99 by 562.887 µs through hardware alone.kvaser_usbpair (D01 vs. D02): Under stockkvaser_usb,KH-UCANFD-PRO-X4U(D02,53.741 µs) lowers mean latency by 91.500 µs compared with Kvaser USBcan Pro 4xHS (D01,145.241 µs), cutting P99 from216.590 µsto78.301 µs.- Takeaway: Over 85% of cross-device latency variation originates in device-side forwarding architecture rather than the Linux SocketCAN or USB host stack.
4.2 Holding Hardware Constant to Isolate Host Driver Overhead
- Same-hardware driver pair (D08 vs. D05): On the same
KH-UCANFD-X2Iunit, switching from stockpeak_usb(D08,48.307 µs) to the nativekcandriver in the KH-UCANFD Linux SDK (D05) lowers mean by 6.238 µs to 42.069 µs and tightens P99 by 12.441 µs to 64.795 µs. - Cross-form-factor consistency (D04 vs. D05): Under
kcan, 4-channelKH-UCANFD-B2B-X4(D04,42.174 µs) and 2-channelKH-UCANFD-X2I(D05,42.069 µs) agree within 0.105 µs.
4.3 Syscall and User-Space Scheduling Overhead
Comparing Tables 3-1 and 3-2, D04 application one-way mean (48.465 µs) exceeds kernel boundary (42.174 µs) by 6.291 µs (6.038 µs on D05, 6.664 µs on D08), quantifying unilateral write() / recvmsg() syscall, socket queue copy, and SCHED_FIFO wakeup cost under PREEMPT_RT.
5. Multi-Round Stability, Repeatability, and 11-Condition Sweeps
5.1 30-Round Continuous Stability and Cross-Port Repeatability
Select any setup (D01–D08, R01) in the Configuration dropdown to inspect its 30-round trajectory and per-round table:
Kernel one-way estimate · µs · Symmetric TX/RX estimate; lower values indicate shorter path times.
Range of round means:40.461–43.241 µs。
View round data
| Round | Mean | P50 | P99 | Observed max |
|---|---|---|---|---|
| 1 | 42.867 | 44.518 | 63.417 | 78.523 |
| 2 | 40.863 | 42.628 | 59.508 | 78.196 |
| 3 | 40.461 | 41.318 | 61.443 | 79.476 |
| 4 | 42.846 | 41.312 | 65.432 | 77.995 |
| 5 | 42.690 | 41.398 | 64.713 | 78.197 |
| 6 | 43.241 | 45.014 | 65.003 | 80.185 |
| 7 | 43.118 | 41.914 | 64.339 | 83.823 |
| 8 | 41.950 | 42.876 | 65.052 | 80.412 |
| 9 | 41.865 | 42.378 | 67.177 | 83.079 |
| 10 | 42.562 | 43.905 | 62.946 | 79.801 |
| 11 | 42.711 | 41.508 | 66.697 | 79.814 |
| 12 | 42.725 | 44.352 | 64.015 | 78.904 |
| 13 | 42.389 | 40.961 | 65.140 | 78.023 |
| 14 | 41.518 | 43.095 | 61.087 | 77.735 |
| 15 | 42.453 | 41.240 | 64.771 | 78.855 |
| 16 | 42.836 | 44.990 | 63.003 | 77.711 |
| 17 | 41.981 | 42.283 | 67.334 | 80.512 |
| 18 | 43.013 | 41.672 | 67.251 | 79.956 |
| 19 | 41.781 | 42.545 | 64.979 | 80.350 |
| 20 | 43.088 | 44.855 | 64.339 | 83.127 |
| 21 | 41.987 | 41.205 | 63.580 | 79.069 |
| 22 | 42.317 | 41.860 | 67.982 | 80.736 |
| 23 | 40.763 | 41.140 | 64.987 | 79.268 |
| 24 | 41.923 | 43.576 | 62.427 | 75.516 |
| 25 | 40.551 | 42.353 | 55.543 | 79.243 |
| 26 | 42.641 | 41.581 | 67.111 | 93.903 |
| 27 | 42.074 | 41.087 | 71.976 | 79.017 |
| 28 | 41.538 | 43.332 | 60.092 | 76.786 |
| 29 | 41.977 | 40.455 | 64.692 | 79.561 |
| 30 | 42.475 | 41.500 | 66.116 | 79.977 |
- 30-round thermal stability: Across 30 consecutive 10,000-frame rounds, D04 round means stay within 40.461–43.241 µs (
2.780 µspeak-to-peak range) with zero thermal drift. - Cross-port repeatability (D08 vs. R01): Re-running 300,000 frames on a separate physical USB root port (R01) yields a kernel mean of 48.389 µs versus 48.307 µs on D08 (0.082 µs delta,
< 0.2%) and P99 of 76.997 µs versus 77.236 µs.
5.2 11-Condition Bit-Rate and Period Sweep Analysis
An 11-point sweep (10 rounds × 10,000 frames = 100,000 frames per condition, values in µs) was acquired on native KCAN hardware across 5 bit-rate pairs and 6 transmit periods (80–1,000 µs):
Kernel one-way estimate · µs · Symmetric TX/RX estimate; lower values indicate shorter path times.
View operating-point statistics (µs)
| Nominal / data rate | Period | Mean | P99 | Observed max |
|---|---|---|---|---|
| 1 / 8 Mbit/s | 100 µs | 40.057 | 62.828 | 91.790 |
| 1 / 2 Mbit/s | 100 µs | 41.780 | 68.893 | 107.158 |
| 1 / 4 Mbit/s | 100 µs | 41.143 | 67.038 | 84.869 |
| 0.8 / 4 Mbit/s | 100 µs | 39.722 | 68.394 | 79.499 |
| 0.5 / 4 Mbit/s | 100 µs | 46.839 | 69.606 | 84.362 |
| 1 / 8 Mbit/s | 1000 µs | 54.918 | 70.788 | 114.870 |
| 1 / 8 Mbit/s | 400 µs | 53.462 | 67.648 | 103.164 |
| 1 / 8 Mbit/s | 250 µs | 52.392 | 66.847 | 109.079 |
| 1 / 8 Mbit/s | 125 µs | 45.746 | 58.454 | 75.096 |
| 1 / 8 Mbit/s | 80 µs | 42.201 | 68.112 | 76.280 |
| 1 / 8 Mbit/s (repeat) | 100 µs | 41.172 | 62.667 | 80.870 |
| Condition ID | Nominal / Data Rate | Period | Kernel Mean | Kernel P50 | Kernel P99 | App Mean | App P99 | App − Kernel |
|---|---|---|---|---|---|---|---|---|
baseline | 1 / 8 Mbit/s | 100 µs | 40.057 | 39.873 | 62.828 | 44.894 | 68.298 | +4.837 |
baseline_repeat | 1 / 8 Mbit/s | 100 µs | 41.172 | 41.226 | 62.667 | 46.192 | 68.214 | +5.020 |
bitrate_1M_4M | 1 / 4 Mbit/s | 100 µs | 41.143 | 39.123 | 67.038 | 46.567 | 72.781 | +5.424 |
bitrate_1M_2M | 1 / 2 Mbit/s | 100 µs | 41.780 | 39.273 | 68.893 | 46.821 | 74.290 | +5.041 |
bitrate_800k_4M | 0.8 / 4 Mbit/s | 100 µs | 39.722 | 38.049 | 68.394 | 44.709 | 73.275 | +4.987 |
bitrate_500k_4M | 0.5 / 4 Mbit/s | 100 µs | 46.839 | 45.628 | 69.606 | 53.977 | 78.055 | +7.138 |
period_80us | 1 / 8 Mbit/s | 80 µs | 42.201 | 38.637 | 68.112 | 45.963 | 71.944 | +3.762 |
period_125us | 1 / 8 Mbit/s | 125 µs | 45.746 | 46.183 | 58.454 | 53.127 | 67.462 | +7.381 |
period_250us | 1 / 8 Mbit/s | 250 µs | 52.392 | 53.898 | 66.847 | 68.570 | 91.239 | +16.178 |
period_400us | 1 / 8 Mbit/s | 400 µs | 53.462 | 54.581 | 67.648 | 71.311 | 94.058 | +17.849 |
period_1000us | 1 / 8 Mbit/s | 1,000 µs | 54.918 | 56.247 | 70.788 | 76.550 | 100.200 | +21.632 |
- Bit-rate independence of deducted path latency: At
100 µsperiod, varying data rate from8 Mbit/sto2 Mbit/sleaves kernel path mean within 39.7–41.8 µs, validating per-frame TCAN deduction. - USB microframe phase and CPU idle C-state wakeup under longer periods: Relaxing period from
100 µs(10 kHz) to1,000 µs(1 kHz):- Kernel mean rises
+14.861 µs(40.057 → 54.918 µs) due to average USB 2.0125 µsmicroframe phase alignment and xHCI interrupt moderation, while kernel P99 remains bounded at 70.788 µs. - App–kernel delta widens from
+4.837 µsto+21.632 µs(+16.795 µs) because CPU cores enter power-saving idle C-states during1 mssleep intervals and incur wakeup exit latency upon RX interrupt arrival.
- Kernel mean rises
5.3 Host Low-Jitter Configuration Recommendations
Based on Section 5.2, four host settings are recommended for 500 Hz–2 kHz control deployments (commands can be generated via the SocketCAN Command Generator):
- Real-time kernel and core pinning: Use
PREEMPT_RT, setSCHED_FIFO(priority ≥ 80), and pin TX/RX threads to dedicated cores. - Constrain CPU C-states and USB autosuspend: Add
processor.max_cstate=1(or hold/dev/cpu_dma_latencyat0) and disable USB port autosuspend to eliminate the ~17 µs idle wakeup penalty. - Enable BRS and sufficient TX queue length: Configure
fd onwith8000000or5000000data bit rate and setip link set can0 txqueuelen 1000. - Aggregate outbound commands: Pack multi-node targets into single
24–64 BCAN FD frames to minimize syscalls and arbitration overhead.
6. Raw Dataset Downloads and Field Schema
Field Definitions
- Units: All timing columns (
min_us,mean_us,p50_us,p95_us,p99_us,max_us,std_us, and JSONcdfx-values) are in microseconds (µs). - Formula convention: In
comparison-summary.csv,comparison-summary.json, andkcan-sweep-summary.csv,kernelandappmetrics are stored as symmetric one-way estimates (((T3 - T2) - T_CAN) / 2and((T4 - T1) - T_CAN) / 2); multiply by 2 for bilateral interface transit time in closed-loop budgets.
| Revision | Date | Description |
|---|---|---|
| 2.0 | 2026-11-19 | Expanded into the complete Benchmark Test Report integrating ISO 11898-1:2015 wire-time equation, full 9-setup kernel/app quantile tables out to P99.99, variable isolation analysis, and 11-point C-state wakeup breakdown. |
| 1.0 | 2026-11-17 | Initial release of measurement methodology, 8-device comparison, repeatability, and sweep datasets. |