SocketCAN Basic Configuration
Core Concepts
- CAN Interface: Linux system maps CAN devices to network interfaces (such as can0, can1), which can be managed through network commands.
- Bit Rate: CAN bus communication rate. Common values are 250 kbit/s, 500 kbit/s, 1 Mbit/s. Must be consistent across all nodes.
- CAN Frame: Contains ID (identifier), data field (0-8 bytes for CAN 2.0, 0-64 bytes for CAN FD), control field, etc. Divided into standard frame (11-bit ID) and extended frame (29-bit ID).
Environment Preparation
Install required tools:
sudo apt install iproute2Kernel Support Check
First confirm whether kernel has SocketCAN module enabled. You can check through lsmod command:
# Check CAN core module
lsmod | grep can

# If not loaded, manually load core module
sudo modprobe can
sudo modprobe kcan # KH-UCANFD driver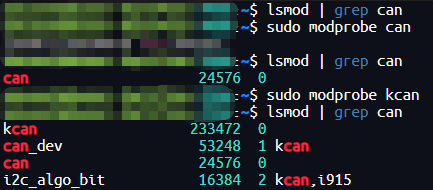
Device Identification
After connecting CAN device, confirm whether device is recognized through following commands:
# View USB device (USB-CAN adapter)
lsusb -t | grep -i can

# View network interface (CAN device mapped to network interface)
ip link show | grep can

# View detailed device information
dmesg | grep -i can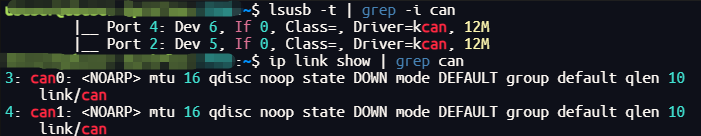
Device Configuration
Before using CAN device, you need to configure parameters such as bit rate and operating mode. Core commands are as follows:
# 1. Close CAN interface (ensure interface is not enabled before configuration)
sudo ip link set can0 down

# 2. Configure parameters
# Example 1: Configure bit rate to 1 Mbit/s
sudo ip link set can0 type can bitrate 1000000

# Example 2: Configure arbitration phase bit rate 1 Mbit/s, data phase bit rate 5 Mbit/s, enable CAN FD mode
sudo ip link set can0 type can bitrate 1000000 dbitrate 5000000 fd on

# Example 3: Configure arbitration phase bit rate 1 Mbit/s sample point 75%, data phase bit rate 5 Mbit/s sample point 80%, enable CAN FD mode
sudo ip link set can0 type can bitrate 1000000 sample-point 0.75 dbitrate 5000000 dsample-point 0.8 fd on

# 3. Enable CAN interface
sudo ip link set can0 up

# 4. Verify configuration result
ip -d link show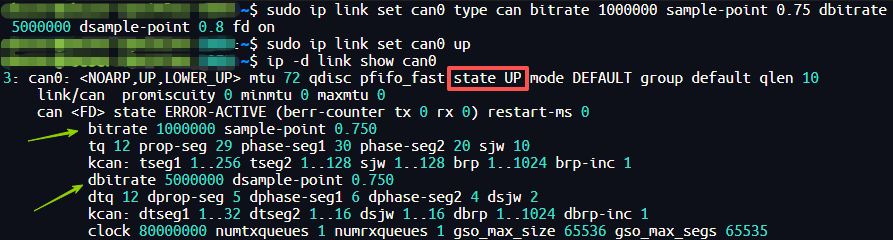
Interface Status
After configuration is complete, view interface status through ip and ifconfig commands to obtain more detailed device runtime information.
Through following commands, you can view CAN device status, error counts, data transmission/reception, and other core information, which is an important means for device debugging.
# Method 1: View device detailed status through ip command (including bit rate, error status, driver, etc.)
ip -d link show

# Method 2: View transmission/reception statistics through ifconfig command (including packet count, error count, etc.)
ifconfig -a
ip -d link show Output Example:
can0: <NOARP,UP,LOWER_UP> mtu 72 qdisc pfifo_fast state UP mode DEFAULT group default qlen 10  # can0 CAN FD mode enabled status
    link/can promiscuity 0 minmtu 0 maxmtu 0
    can <FD> state ERROR-ACTIVE (berr-counter tx 0 rx 0) restart-ms 0
          bitrate 1000000 sample-point 0.750
          tq 12 prop-seg 29 phase-seg1 30 phase-seg2 20 sjw 10
          kcan: tseg1 1..256 tseg2 1..128 sjw 1..128 brp 1..1024
          dbitrate 8000000 dsample-point 0.700
          dtq 12 dprop-seg 3 dphase-seg1 3 dphase-seg2 3 dsjw 1
          kcan: dtseg1 1..32 dtseg2 1..16 dsjw 1..16 dbrp 1..1024
          clock 80000000 numtxqueues 1 numrxqueues 1 gso_max_size 65536 gso_max_segs 65535

can1: <NOARP> mtu 16 qdisc noop state DOWN mode DEFAULT group default qlen 10  # can1 CAN 2.0B mode not enabled status
    link/can promiscuity 0 minmtu 0 maxmtu 0
    can state STOPPED (berr-counter tx 0 rx 0) restart-ms 0
          kcan: tseg1 1..256 tseg2 1..128 sjw 1..128 brp 1..1024
          kcan: dtseg1 1..32 dtseg2 1..16 dsjw 1..16 dbrp 1..1024
          clock 80000000 numtxqueues 1 numrxqueues 1 gso_max_size 65536 gso_max_segs 65535
Key Status Interpretation:
- state UP: Interface enabled; state DOWN: Interface not enabled.
- ERROR-ACTIVE: Normal working status, error counter value is low; STOPPED: Interface stopped working; if BUS-OFF, it indicates bus is closed and communication is impossible.
- berr-counter tx 0 rx 0: Transmit/receive error counter is 0. Higher values indicate greater bus interference. When threshold is exceeded, error state is triggered.
ifconfig -a Output Example and Interpretation:
can0: flags=193<UP,RUNNING,NOARP> mtu 72
        unspec 00-00-00-00-00-00-00-00-00-00-00-00-00-00-00-00 txqueuelen 10 (UNSPEC)
        RX packets 8423  bytes 67384 (67.3 KB)  # Number of received data packets and byte count
        RX errors 0  dropped 0  overruns 0  frame 0  # Statistics of receive errors, dropped packets, etc.
        TX packets 8407  bytes 67256 (67.2 KB)  # Number of transmitted data packets and byte count
        TX errors 0  dropped 0 overruns 0 carrier 0  collisions 0  # Statistics of transmit errors, dropped packets, etc.
Error Handling
When CAN device enters error state, it will directly affect communication and requires timely troubleshooting. You can quickly locate error types through ip -d link show, among which the most common is BUS-OFF (bus-off) status.
# BUS-OFF error status example
can <FD> state BUS-OFF (berr-counter tx 248 rx 127) restart-ms 0
BUS-OFF status is usually caused by continuous severe interference or short circuit on bus. Error counter reaches threshold and device automatically closes bus. Recovery method is as follows:
# Restart CAN device to restore normal status
sudo ip link set can0 down
sudo ip link set can0 up
After recovery, re-check bus connection (such as whether terminating resistor is normal, whether cable is damaged) to avoid triggering error again.